Swift Hotel Group — Hotel Performance Dashboard
Swift Hotel Group is a concept dashboard exploring how hotel booking, revenue, cost and guest feedback data can be presented in a clear, practical reporting system.
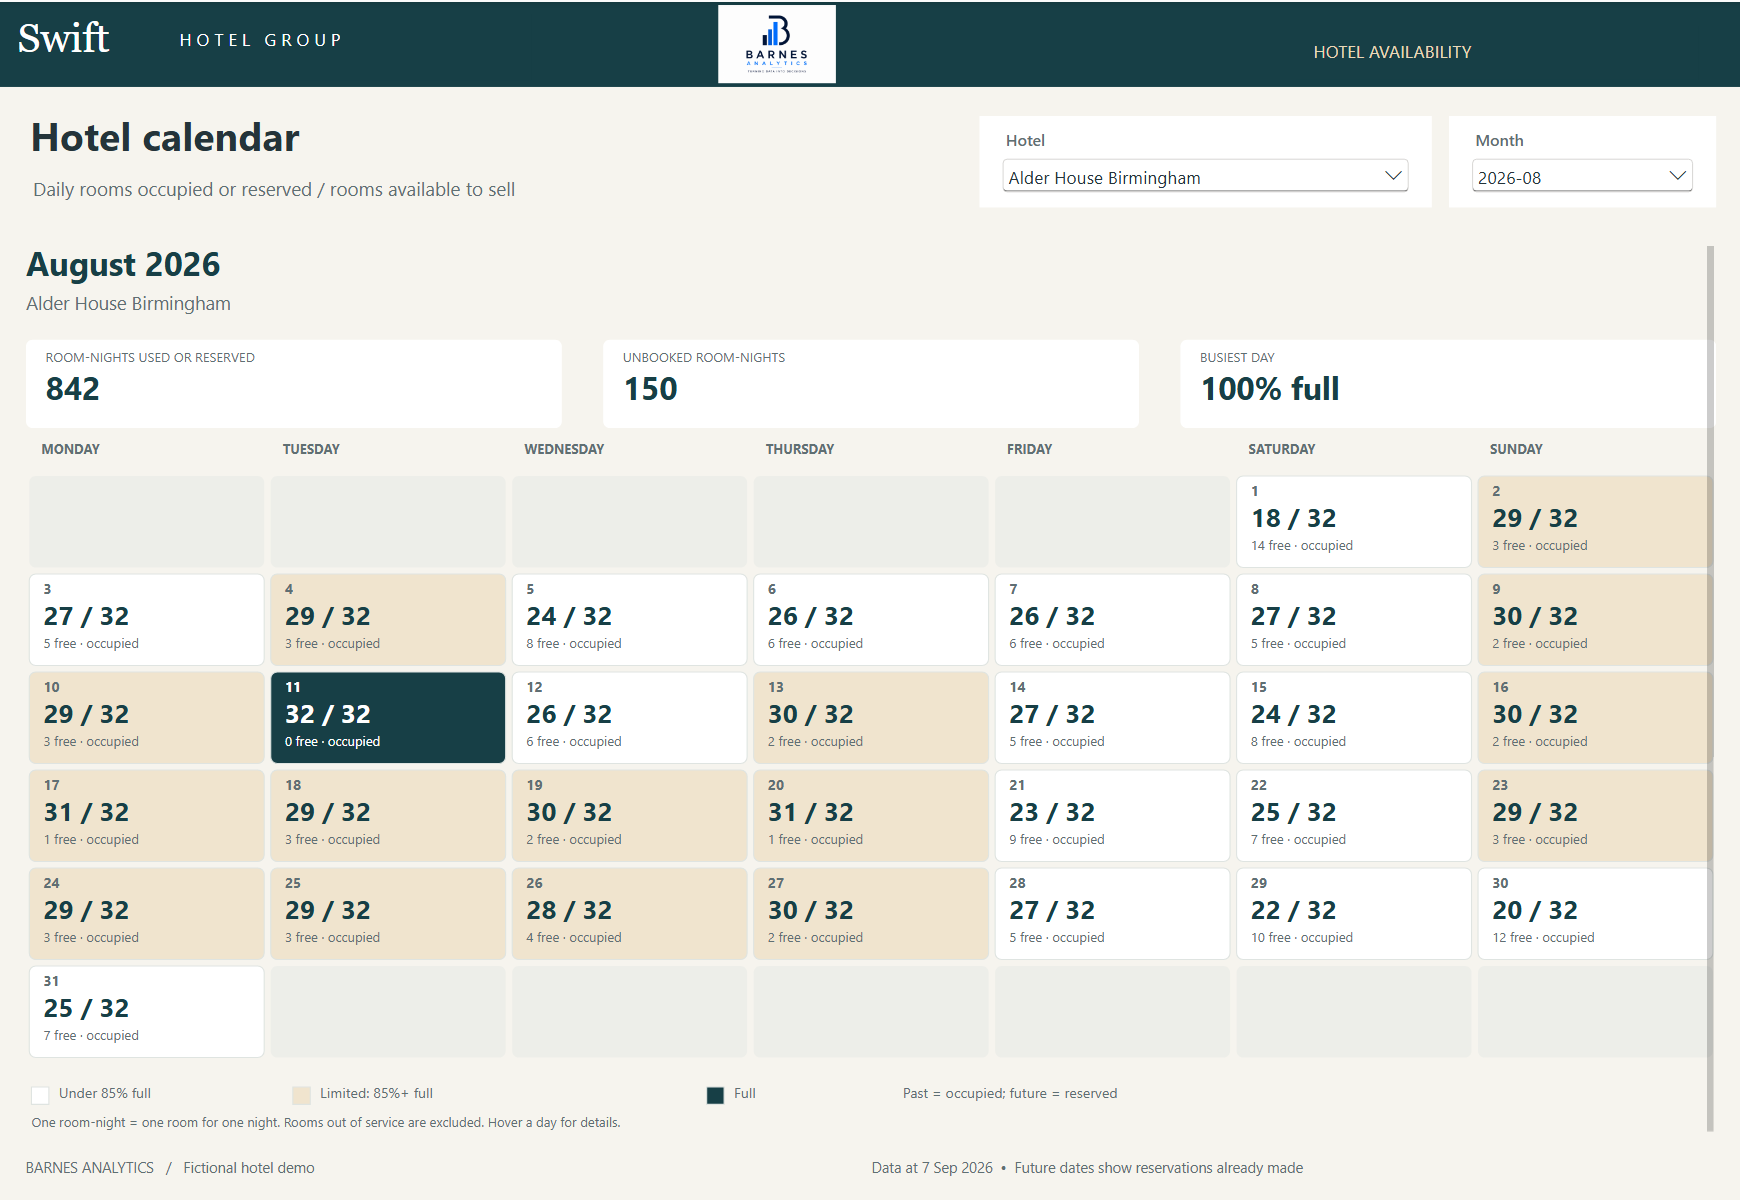
Built in Power BI with custom Deneb visuals, the project uses different ways of visualising information to answer everyday management questions. An occupancy calendar shows rooms booked and available by day, while a world map highlights where guests are travelling from. Supporting pages explore financial performance, booking routes, future demand and guest experience.
The aim is to help managers compare properties, identify dates needing more bookings and understand which costs or guest issues deserve further investigation.
This portfolio demonstration uses a fictional hotel group and synthetic data. Barnes Analytics shaped the reporting requirements and visual direction, with extensive AI assistance in generating the data and developing the technical build.
What it includes and what you could receive
The demonstration includes six interactive reporting pages:
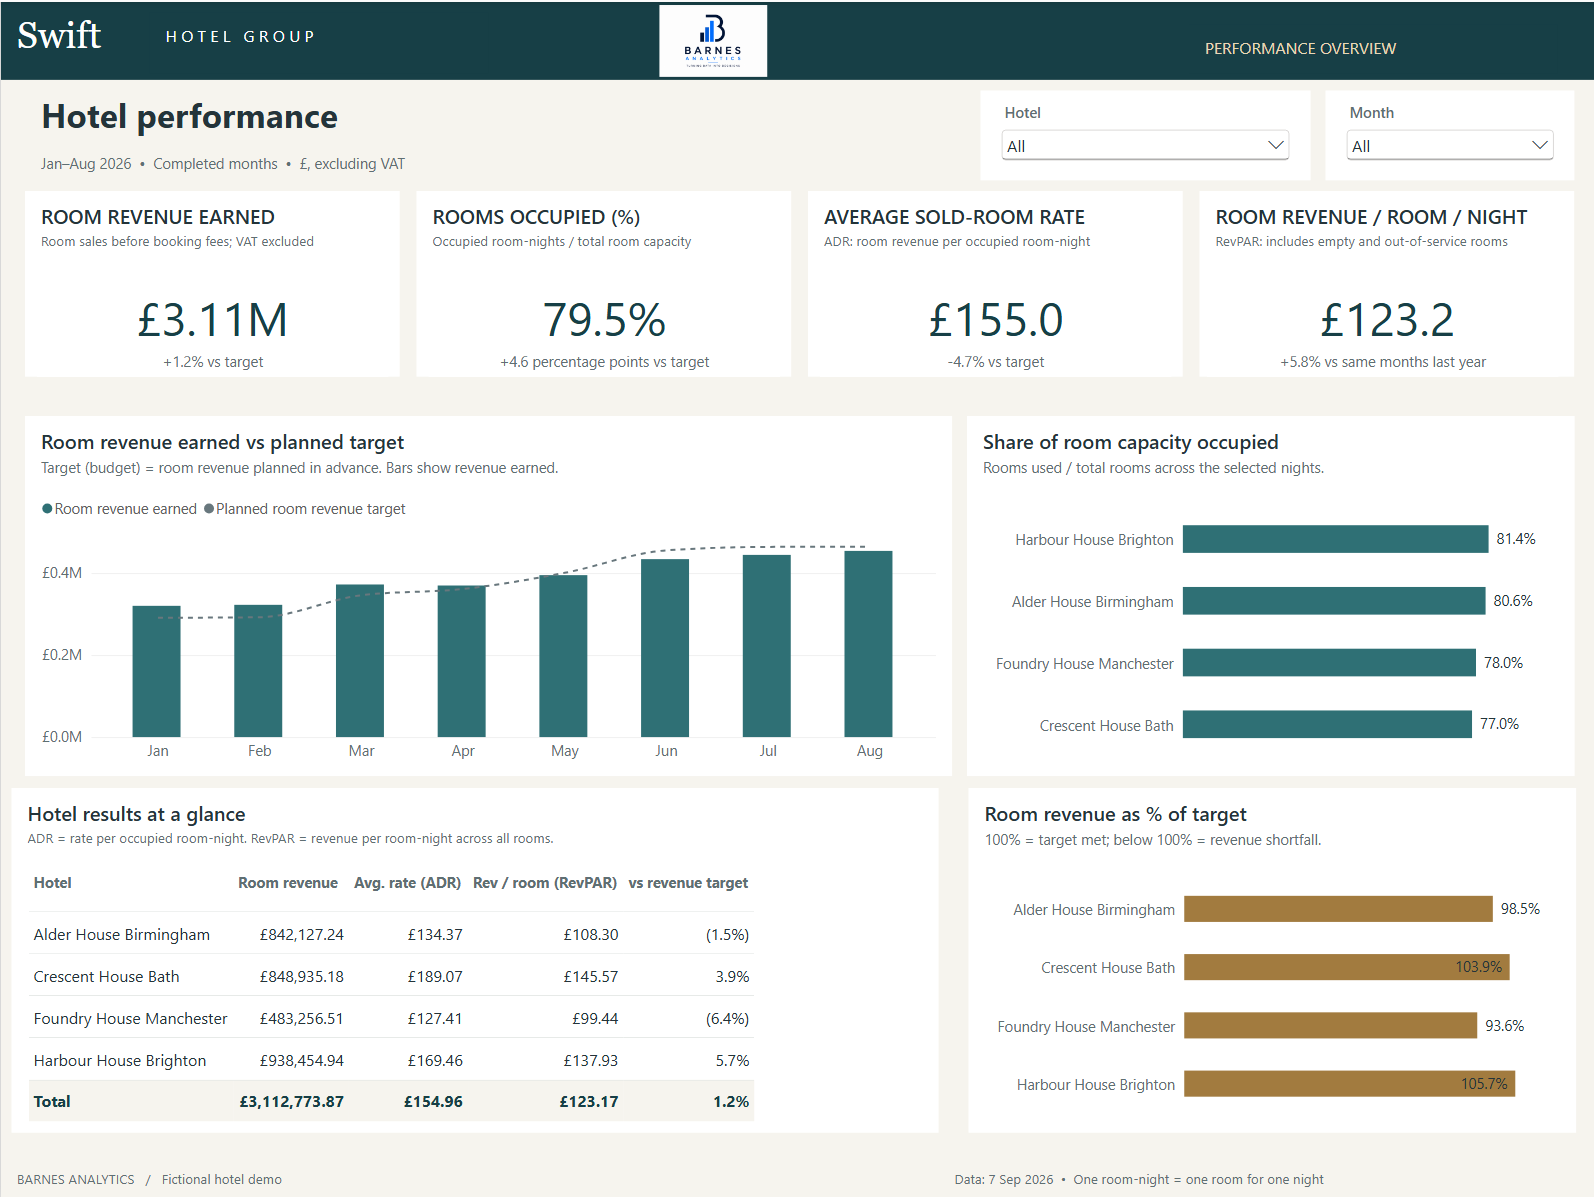
Performance overview: room revenue, occupancy, average room rates and performance against planned revenue targets.
Hotel calendar: daily rooms booked and available, with colour highlighting limited availability.
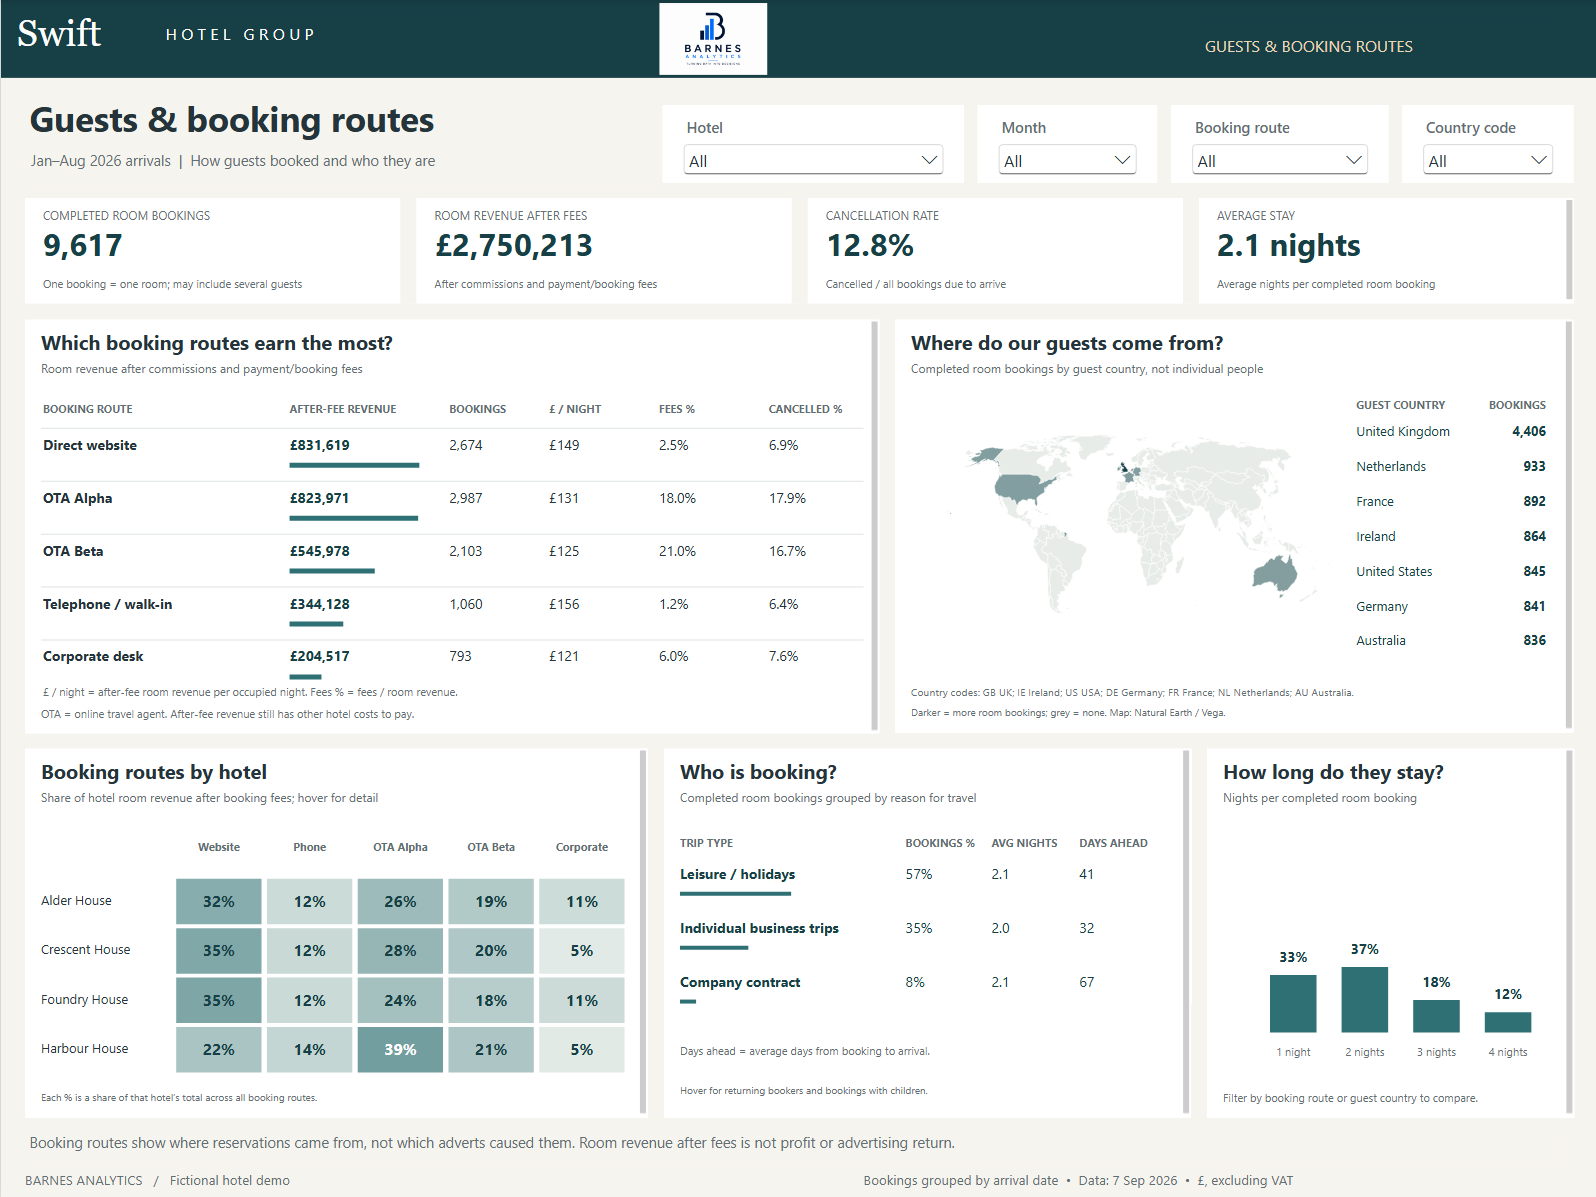
Guests and booking routes: guest origins, customer segments, length of stay, cancellations and room revenue after booking fees.
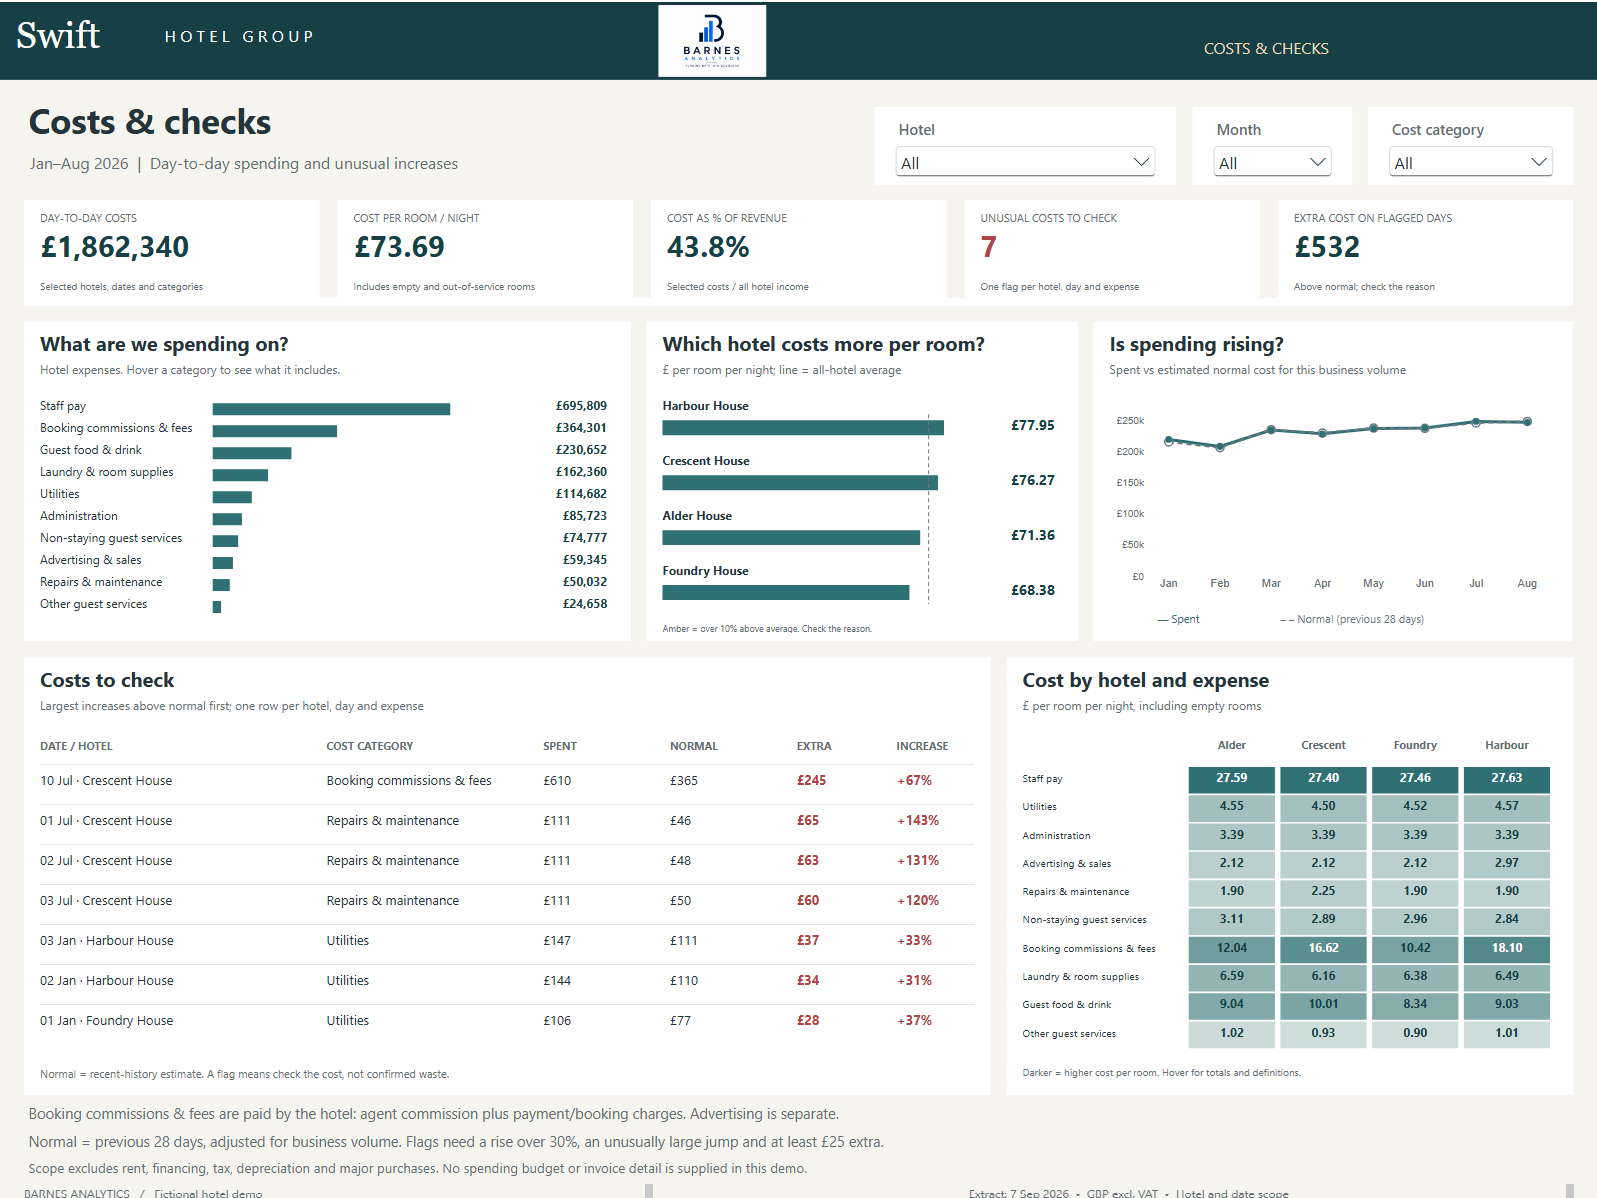
Costs and checks: spending by hotel and category, with unusual increases flagged for investigation.
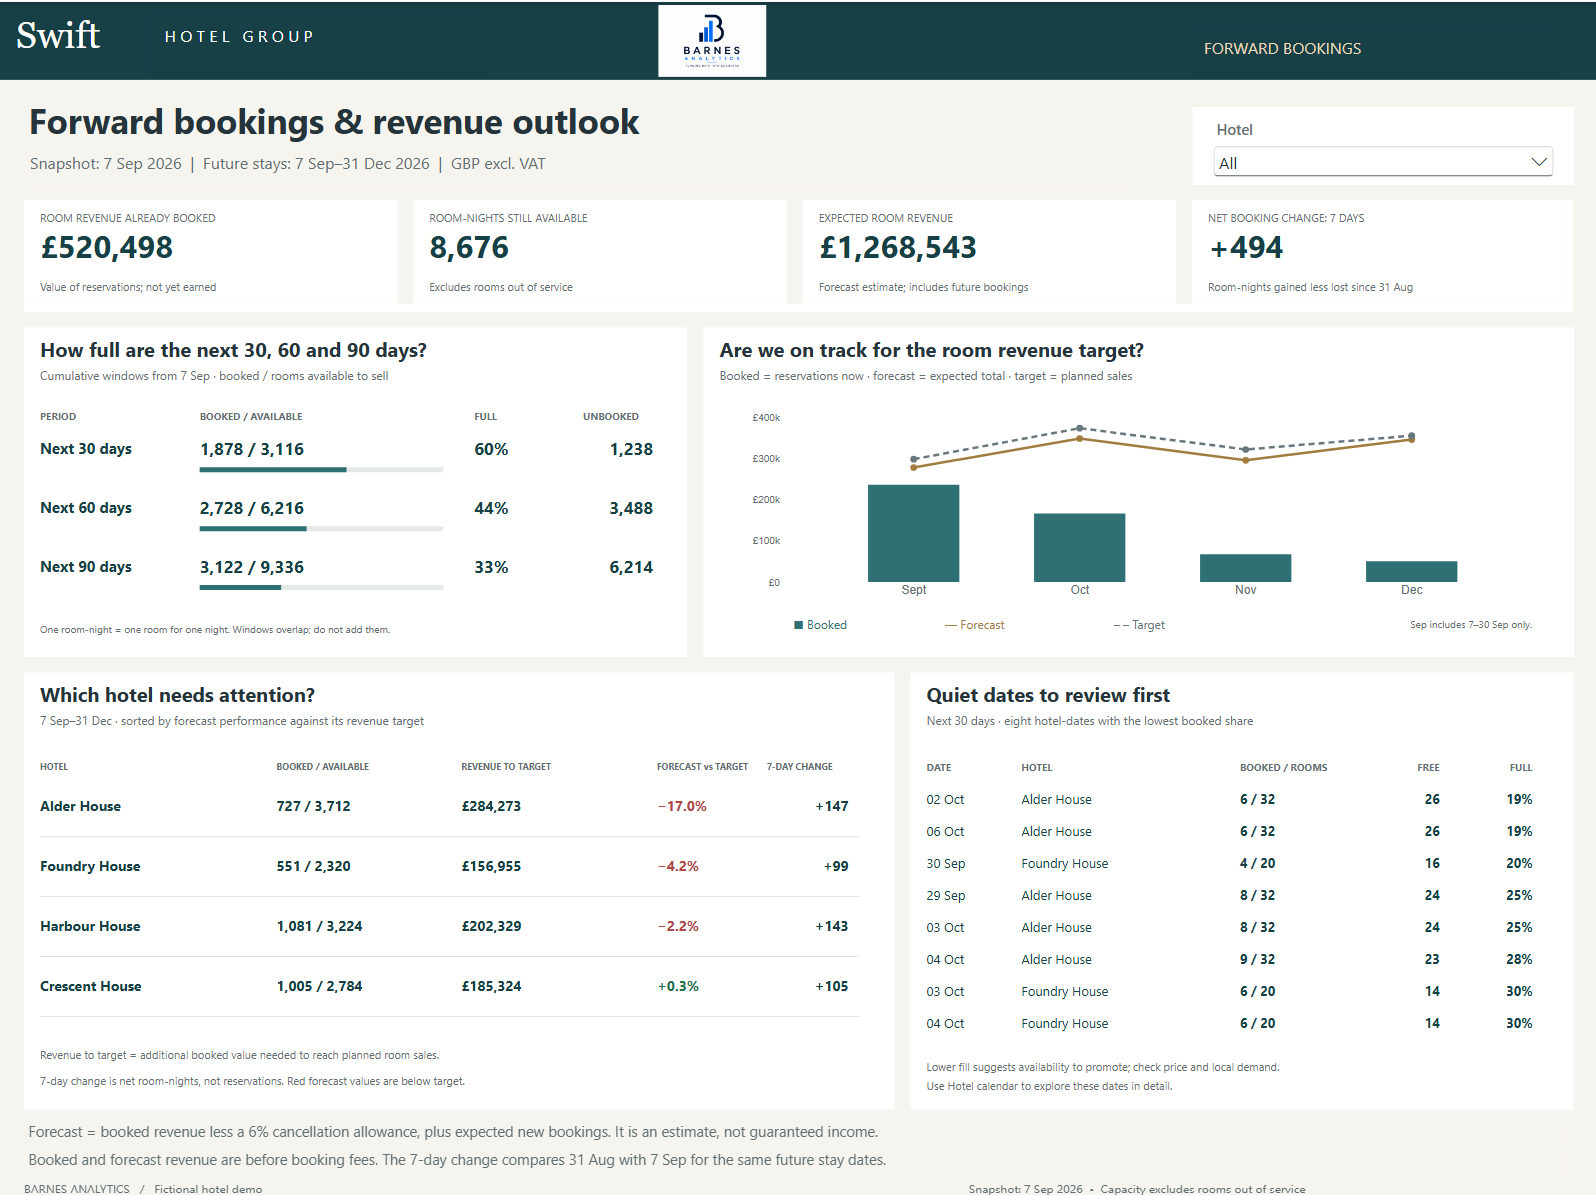
Forward bookings: upcoming availability, booked revenue, forecasts and quiet dates needing attention.
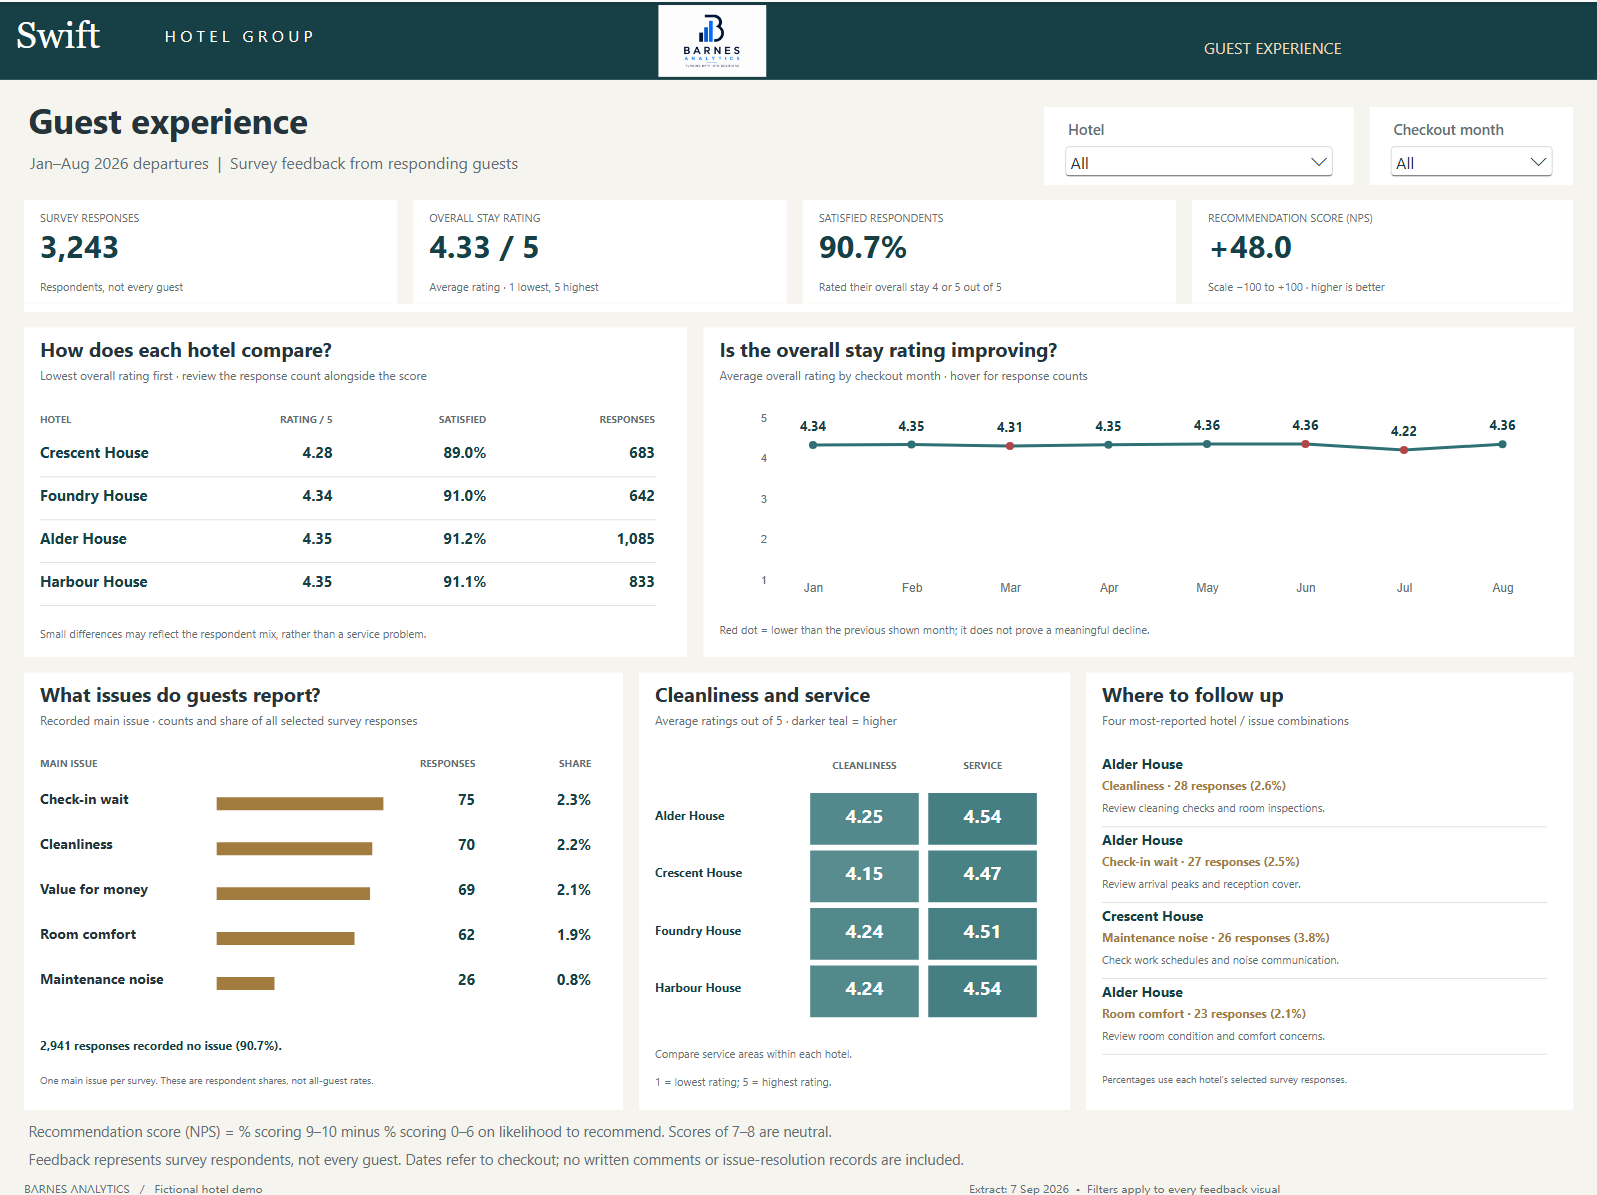
Guest experience: survey ratings, satisfaction trends, reported issues and suggested follow-up checks.
For your hotel or hospitality business, a project could be tailored around the questions you need to answer and the data you already collect. Depending on the agreed scope, this could include:
A branded Power BI dashboard designed around your properties and reporting priorities.
Preparation and connection of suitable Excel, CSV or exports from your existing systems.
Clearly defined measures and targets, with explanations of how figures are calculated.
Interactive filters and custom visuals suited to your team’s needs.
Checks against source data to confirm that reported figures reconcile.
A practical handover explaining how to use, update and interpret the report.
We would begin by reviewing your available data and agreeing a manageable scope. Connections to live systems, scheduled refresh and ongoing support would be assessed separately to establish what is feasible for your setup.